

Who Is the Patsy?
Warren Buffett, who did not invent the line but gave it a permanent seat in the investment literature, put it this way in his 1988 letter to shareholders: “If you’ve been in the game 30 minutes and you don’t know who the patsy is, you’re the patsy.”
The saying is older than Buffett. It dates to the early twentieth century. Poker rooms had it by the late 1970s. The meaning is not subtle. A game has winners and donors. If you cannot identify the donor, the donation is coming from you.
Most investors spend their time identifying the other players—the Fed, the algos, the index funds, the private-credit syndicates, the next cohort of “IT” stocks. They are looking at the wrong table. The largest player is not a hedge fund. It is not a bank. It is the United States government: the world’s largest borrower, its largest spender, and, taken as a whole, its largest employer. It enjoys the deepest access to capital markets of any organization on earth. It also possesses an appetite for money that must be satiated, quarter after quarter, auction after auction. That is not a political observation. It is a market-structure fact. Investors and their advisers who lack a plan for it are volunteering for the role of patsy.
The Whale, In Numbers
Call the federal government what it is—a going concern of unmatched scale.
Borrower. Total public debt outstanding crossed $40 trillion in mid-September 2026. The closest sovereign issuer is China at $22 trillion. The closest corporate issuers are JP Morgan at $1.2 trillion among banks and Toyota at $.28 trillion among non-banks. No corporation, household sector, or other sovereign issues paper in this quantity in a single market. Japan, the largest foreign holder of Treasuries, owns about $1.1 trillion in US Treasury debt—an enormous sum, but still a rounding error next to the issuer.
Spender. The Congressional Budget Office (CBO) puts fiscal 2026 outlays at about $7.4 trillion, or 23 percent of GDP. For comparison, China is the next-largest spender, at $4.3 trillion. Amazon leads corporations at $0.8 trillion.
Employer. Federal employment, civil and defense, was about 4.0 million in August 2026. Add state and local government, and the headcount rises to about 23 million. Walmart, the largest private employer, has about 2.1 million. China employs more people, but its employment budget is smaller. They pay much less. It’s communism. What would you expect?
Access. Through August 2026, the Treasury market absorbed $21.8 trillion of gross issuance and traded an average of $1.20 trillion a day. Total U.S. corporate debt traded on average about $67 billion daily in 2026. $78 billion if you include new issuance. No other borrower can roll this much debt, this often, at this bid-to-cover, in a market the rest of the world treats as the risk-free benchmark. That is “access.” It is also dependence: the auctions must clear.
Appetite. Since fiscal 2026 began on October 1, 2025, total public debt has risen about $2.5 trillion, or 7.5 percent of GDP, in an economy that is not in recession. Think of it. What is borrowed is spent, so somewhere between 5% and 7.5% of all US economic activity is funded with borrowed money through Treasury debt issuance. An organization that must borrow almost a tenth of its output every year is not a referee. It is a principal.
A rising stock market is good for this principal and good for investors. Capital-gains receipts plump the Treasury. Pension and Social Security optics improve. Household confidence holds. Most of the time, Washington and the owners of productive assets are on the same team. Believing it is always so can be very expensive. The alignment is convenient, not contractual.
Why the House Prefers Inflation
Why would the largest player choose inflation? Because it’s the only choice that keeps the game running. The economist Lester Thurow drew the lesson from the Great Depression. In deflation, production stops, people go broke, and politicians lose their seats. Inflation is a quieter problem. The machine keeps humming, and the only question is who gets rich fastest. A government facing that choice will pick inflation every time—and inflation is exactly the risk that nominal accounting, numbers not adjusted for the impact of inflation, cannot see.
When the House Plays for the House
Beyond a certain size, government does not merely referee wealth creation. It competes with it. When the Treasury takes a larger share of the pool of savings, private borrowers—the ones who build plants, houses, and payrolls—pay up. The Bipartisan Policy Center, in an August explainer that should have been unnecessary and wasn’t, made the point without embellishment: the government “competes with private borrowers for the same pool of savings.”
Expanded public spending creates a structural drag on long-term real per-capita growth by diverting resources from the more efficient private sector. In a landmark study for the Cato Journal, economists Gwartney, Holcombe, and Lawson demonstrated that once government spending exceeds roughly 15% to 25% of GDP, a 10-percentage point increase in the state’s share of the economy correlates with a one percentage point decline in long-term growth. Because public expenditure systematically crowds out corporate profits and business investment, monitoring these fiscal headwinds remains essential for managing long-term macro risk. The inflation side of the damage is slow. It does not make headlines. It compounds.
Greg Ip, writing in The Wall Street Journal in May, called the mixture of debt, sticky inflation, and populism “the dangerous brew that’s rattling bond markets.” We recognized the swill earlier. In our Q3 2024 letter, “The Growing Size of Government,” we argued that fiscal scale had ceased to be background noise and become a portfolio problem. The Journal has now discovered the smell that the kitchen has been emitting for years.
In a crisis, the alignment of the government’s best interests with those of investors breaks down more honestly. An organization of this size will, when pressed, serve the goals that ensure its own survival. It will protect the financing of the state and the stability of its payment system, and it will act, even when those goals impose costs on the investors it is meant to serve. Bondholders learned this in 2022. The same government that needed a functioning Treasury market was also the government whose inflation forced the Fed to reprice every duration asset on the books. The lesson is not cynicism; it is institutional: do not confuse the state’s interest with your own, and do not arrive at the table without a plan.
Not Only Crises
Crises concentrate the mind. The ordinary calendar dulls it. A bureaucracy of this scale runs on repeating schedules and mandates: debt-ceiling theater, tax refund season, Treasury refunding announcements, month-end and quarter-end bill supply, the Jackson Hole ritual, the Employment Situation ritual. These are not random. They change the uncertainty and the liquidity offered in the system. Policy is not a lightning bolt. It is a process, and process has a shape.
We have found that shape worth studying. Investor uncertainty and market liquidity are not only functions of earnings and rates. They also depend on how and when a very large organization makes and implements decisions. A nimble investor can treat that calendar as information. A complacent one treats it as weather.
If The Tools Do Not Measure the Goal—The Tools Aren’t Useful
A second mismatch is related, quieter, and just as costly. Most of the investment industry measures nominal returns and nominal risk. Investors live in real returns—the change in what a dollar buys. Purchasing power is the experience. The brokerage statement is the abstraction.
The Capital Asset Pricing Model, and the risk budgets it spawned, define risk as the variance of nominal returns. Follow that definition to its logical end and the “risk-free” asset is the Treasury bill. Park everything there, and you have minimized the risk the model can see. Over long stretches, you have also surrendered to inflation. Annualized compounded real returns on T-bills across the 55-year period from 1971 to 2025 have been about 0.48 percent a year.1 Especially for those living on the income, it preserves the dollar, not the standard of living.
Measure the same history in real terms, and the investment solutions change. Losses appear that the nominal ledger politely left out.
 Real-Return Allocation Framework
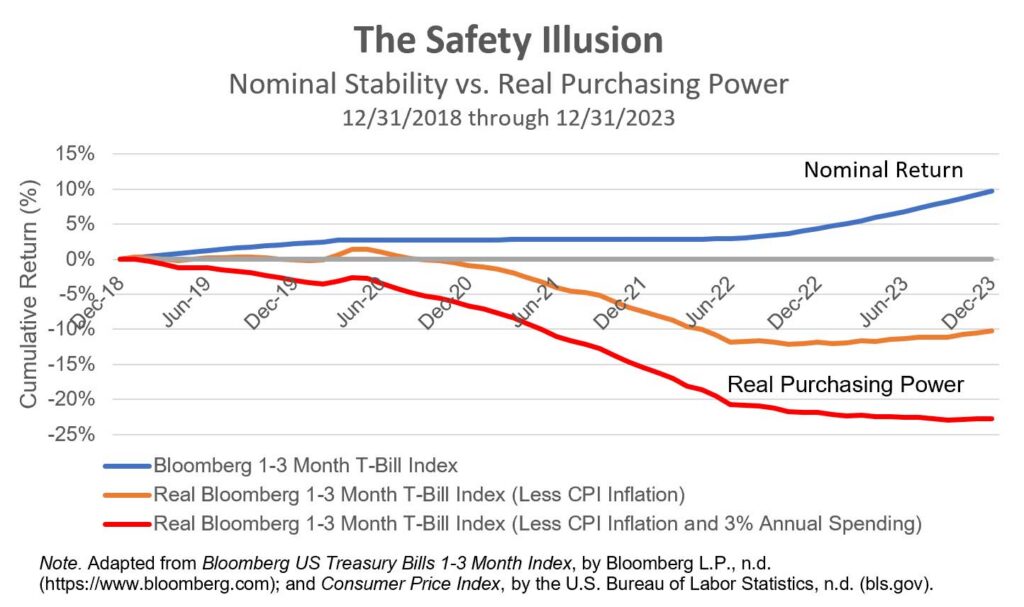
Cash. The chart below maps the stark divergence between what an investor thinks they are making (nominal return) and what they actually experience (purchasing power) in cash instruments during periods of high fiscal intervention.2 In this case, the fiscal and monetary response to COVID.
Intermediate-term government bonds. In the Ibbotson/SBBI history since 1926, intermediate Treasuries compounded at about 5.2 percent a year before inflation and about 2.1 percent after it.
A two percent real return is not nothing. It is also not 5 percent. Moreover, it’s not reliable when inflation is the problem the bonds were hired to solve. For example, in 2022, the Bloomberg U.S. Treasury index fell about 12.5 percent in nominal terms, the worst calendar year in its history. Consumer prices rose 6.5 percent. The real loss was not 12.5 percent. It was closer to 18 percent. The conventional 60/40 portfolio, as we noted at year-end 2025, was down roughly 16 percent after inflation. The ballast sank with the ship.
Gold.
Gold bullion pays no coupon, and its price is volatile at times, so it looks like added risk in a nominally based asset allocation model. In real terms, it has a different profile. Over very long periods it has done more than keep pace with inflation; over the past half-century the World Gold Council has shown a real return closer to the growth of the world economy than to zero.
In the inflation of the 1970s, gold was not a curiosity. It was one of the few assets that enlarged purchasing power while bonds and bills were being quietly expropriated. In 2022, the year intermediate bonds suffered their record nominal loss, gold was roughly flat in dollars and down only modestly after CPI—an unglamorous result that was, in real terms, a victory relative to duration.
The two assets trade places depending on whether the math admits inflation.
That is the claim, and it is not exotic. Use tools that describe the investor’s actual experience, and you get different answers about how to meet the investor’s actual goals. Use tools that describe the brokerage statement, and you will optimize the statement.
Making Government the Patsy
The problem to be solved is therefore double. First: a state large enough to dominate the economy and the markets will, in the ordinary course of operations, create inflation and volatility as it funds itself, and in the extraordinary course will protect itself first. Second: the industry’s risk machinery is calibrated to nominal dollars, so it systematically mis-measures the damage and mis-identifies the solutions.
An investment approach that does not account for both facts is not conservative. It is unprepared. Preparation has two sides. One is protection—refusing to confuse “low nominal volatility” with “safety of purchasing power,” and refusing to assume that the asset the government issues in unlimited quantity is the asset that will spare you from the government. The other is opportunity. A whale of this size creates large waves across the policy calendar, in the certainty/uncertainty cycle, in the moments when liquidity is offered and the moments when it is withdrawn. The aim is not to fight City Hall. The aim is to know who is writing the rules of the game, and to arrange one’s hand accordingly.
Of course, “Stocks for the long run” and all that. But when it comes to managing risk, if you do not know who the patsy is, you are the patsy. We do not intend to be the patsy. We intend to make the state our patsy.
